Integrate Grafana#
The postproduction step in software development is crucial to tracking performances, correcting bugs, and improving an application.
👉 Django & Snowflake Integration - Free Coding Sample
👉 Get Support via email and Discord
With Django, you can integrate Grafana, a powerful tool to aggregate logs and view these logs on the dashboard. Today, we will learn how to integrate Grafana with Django.
👉 New to App-Generator? Sign IN with GitHub or Generate Web Apps in no time (free service).
Project Setup#
For this project, download the code base at this branch respectfully.
git clone -b base --single-branch https://github.com/app-generator/docs-django-grafana.git
cd  docs-django-grafana
After that, install the dependencies.
pip install -r requirements.txt
You can now run migrations and start the project.
python manage.py migrate
python manage.py runserver
The project will be running at http://localhost:8000.
Create Transaction App#
We will add an application and dummy data to monitor the data better. At the root of the project, run the following commands:
python manage.py startapp transactions
This will create a new Python package called transactions with files such as models.py and views.py that we will modify. But before that, make sure the newly created application is registered in the INSTALLED_APPS in the settings.py file of the project.
# core/settings.py

INSTALLED_APPS = [

   ...

   # APPS
   "home",
   "transactions",
   # Util
   "debug_toolbar",
   "rest_framework"
]
After that, we can add the Transaction model. In the transactions/models.py file, add the following code:
# transactions/models.py

from django.db import models
from django.utils import timezone

class Transaction(models.Model):
    user_id = models.IntegerField()
    amount = models.DecimalField(max_digits=10, decimal_places=2)
    transaction_type = models.CharField(max_length=10)
    timestamp = models.DateTimeField(default=timezone.now)

    def __str__(self):
        return f"Transaction: {self.user_id} - {self.amount} ({self.transaction_type})"
Then, we can add the TransactionSerializer. In the transactions/serializers.py file, add the following code:
# transactions/serializers.py

from rest_framework import serializers
from .models import Transaction

class TransactionSerializer(serializers.ModelSerializer):
    class Meta:
        model = Transaction
        fields = ["id", "user_id", "amount", "transaction_type", "timestamp"]
With the serializer added, we can now add a DRF view to expose the transaction data.
# transactions/views.py
from rest_framework import generics
from .models import Transaction
from .serializers import TransactionSerializer

class TransactionListView(generics.ListAPIView):
    queryset = Transaction.objects.all()
    serializer_class = TransactionSerializer
With this done, we can register this view so we can access it from our Django application. In the home/urls.py add the following lines of code:
from django.urls import path
from . import views
from transactions.views import TransactionListView as transactions

urlpatterns = [
    path("", views.index, name="index"),
    path("transactions/", transactions.as_view(), name="transaction-list"),
]
After that, run the migrations to create a new table in the database that we will fill with data. Run the following commands:
python manage.py makemigrations
python manage.py migrate
These commands will create a table in the DB and commit these changes to the database. After that, add this Python script to the transactions directory.
import random
from decimal import Decimal
from .models import Transaction

def create_dummy_transactions(num_records=20000):
    transaction_types = ["credit", "debit"]

    for _ in range(num_records):
        user_id = random.randint(1, 100)
        amount = Decimal(random.uniform(1.00, 1000.00)).quantize(Decimal("0.01"))
        transaction_type = random.choice(transaction_types)

        Transaction.objects.create(
            user_id=user_id, amount=amount, transaction_type=transaction_type
        )

    print(f"{num_records} dummy transactions added to the database.")
We will run this function to insert 20000 transaction entries in the database. This will be used for testing with Grafana. Open the Python shell and type the following commands.
>>> from transactions.dummy_data import create_dummy_transactions
>>> create_dummy_transactions()
20000 dummy transactions added to the database.
With the data added now, we can move to add an endpoint that will expose logs regarding SQL queries made and their time.
Exposing Db Logs#
In some scenarios, you may want to expose the logs of database queries directly from a file for easier monitoring and visualization. This can be useful when monitoring query performance, detecting slow queries, or analyzing query patterns over time. In this section, we`ll walk through how to capture SQL query logs in a file, expose these logs via an API, and make them accessible for monitoring using tools like Grafana or other log analysis platforms.
Enable SQL Query Logging in Django#
Django provides built-in logging capabilities that allow you to track SQL queries executed by your application. By configuring Django`s logging system, you can output SQL queries to a log file. This file can later be exposed via an API for external monitoring.
In your settings.py, configure logging to capture database queries:
# core/settings.py
...
LOGGING = {
    "version": 1,
    "disable_existing_loggers": False,
    "handlers": {
        "file": {
            "level": "DEBUG",
            "class": "logging.FileHandler",
            "filename": "sql_queries.log",
        },
    },
    "loggers": {
        "django.db.backends": {
            "level": "DEBUG",
            "handlers": ["file"],
        },
    },
}
This setup logs all SQL queries executed by Django into a file named sql_queries.log located in the root directory of your project.
Each log entry includes the SQL query, the execution time, and additional details about the query.
Exposing the Logs via an API#
Once the logs are captured in a file, the next step is to expose them through an API so that monitoring tools like Grafana can access and visualize them. We can create a simple Django view to read and parse the log file, returning the results in a structured format like JSON.
Create a View to Expose the Logs:
In your home/views.py, create a function-based view that reads the contents of the log file and returns it as JSON.
This view will parse each log entry to provide useful information such as the query type (SELECT, INSERT, etc.), the execution time, and the full query.
@api_view(["GET"])
def get_sql_logs(request):
    log_file = os.path.join(settings.BASE_DIR, "sql_queries.log")
    data = {"total_queries": 0, "total_time": 0, "query_details": []}

    try:
        with open(log_file, "r") as file:
            logs = file.readlines()

        for log in logs:
            match = re.search(LOG_REGEX, log)
            if match:
                time_taken = float(match.group("time"))
                query = match.group("query").strip()
                args = match.group("args").strip()
                alias = match.group("alias").strip()

                data["total_queries"] += 1
                data["total_time"] += time_taken

                data["query_details"].append(
                    {
                        "time": time_taken,
                        "query": query,
                        "args": args,
                        "alias": alias,
                    }
                )

        data["average_time"] = (
            data["total_time"] / data["total_queries"]
            if data["total_queries"] > 0
            else 0
        )

        return Response(data)

    except FileNotFoundError:
        return Response({"error": "Log file not found."}, status=404)
The JSON format returned by the API can be easily consumed by monitoring tools like Grafana. For example, the API returns metrics such as total query count, average query time, and individual query details. This allows you to visualize important metrics like:
Total Queries: Track the total number of SQL queries over time.
Average Query Time: Monitor the average time taken by SQL queries to identify performance bottlenecks.
Slow Queries: Detect and visualize slow queries by filtering logs based on execution time.
Here`s an example JSON response from the API:
{
    "total_queries": 5,
    "total_time": 0.325,
    "average_time": 0.065,
    "logs": [
        {
            "time": 0.045,
            "query": "SELECT * FROM myapp_transaction WHERE id=1",
            "args": "()",
            "alias": "default"
        },
        {
            "time": 0.056,
            "query": "INSERT INTO myapp_transaction (user_id, amount, transaction_type) VALUES (1, 500.00, 'credit')",
            "args": "()",
            "alias": "default"
        }
    ]
}
URL Configuration:
Add the URL for this view in home/urls.py:
# home/urls.py

from django.urls import path
from . import views
from transactions.views import TransactionListView as transactions

urlpatterns = [
    path("", views.index, name="index"),
    path("sql-logs/", views.get_sql_logs, name="sql-logs"), # new url
    path("transactions/", transactions.as_view(), name="transaction-list"),
]
Now, you can access the database logs by visiting the endpoint http://localhost:8000/sql-logs/.
Grafana#
Grafana is a powerful tool for monitoring, querying, and visualizing data. By integrating it with Django, you can monitor your application`s metrics or visualize data stored in your Django models. Let’s start by installing the tool.
Download and install Grafana for your operating system. You can find the latest version here. After installing, start the Grafana service. For Linux:
sudo systemctl start grafana-server
sudo systemctl enable grafana-server
For macOS (using Homebrew):
brew services start grafana
Open Grafana by going to http://localhost:3000 in your browser. Use the default username and password (admin/admin) to log in.
Change the password when prompted. We will add a JSON data source that Grafana will listen to for logging the SQL requests and their time.
Add Infinity Data Source#
In Grafana, go to Configuration > Data Sources.
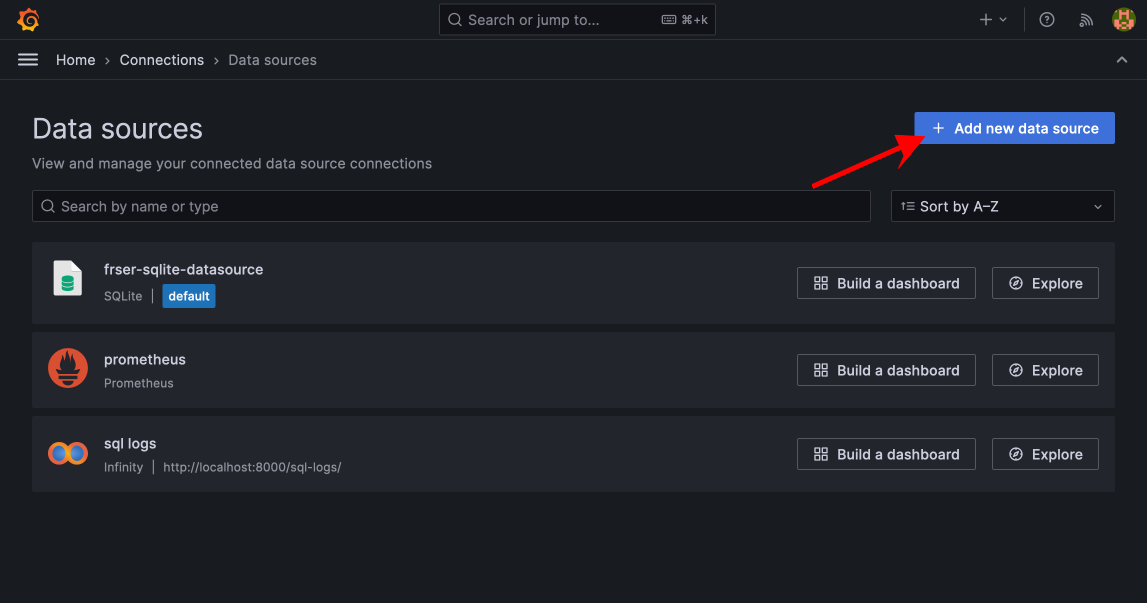
Click on Add data source and search for Infinity.
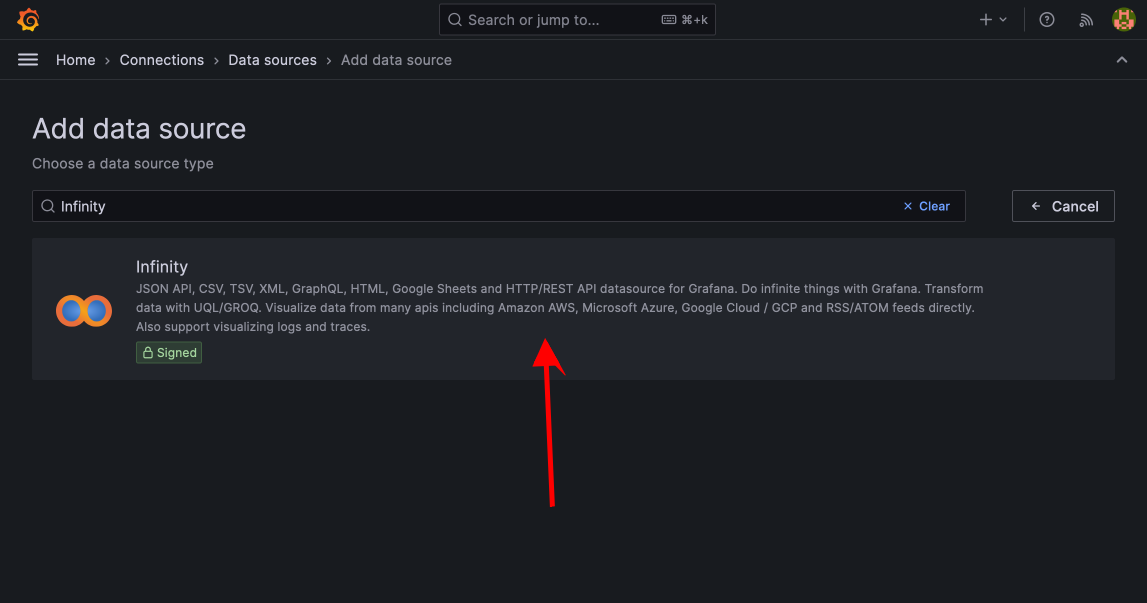
Select Infinity as the data source.
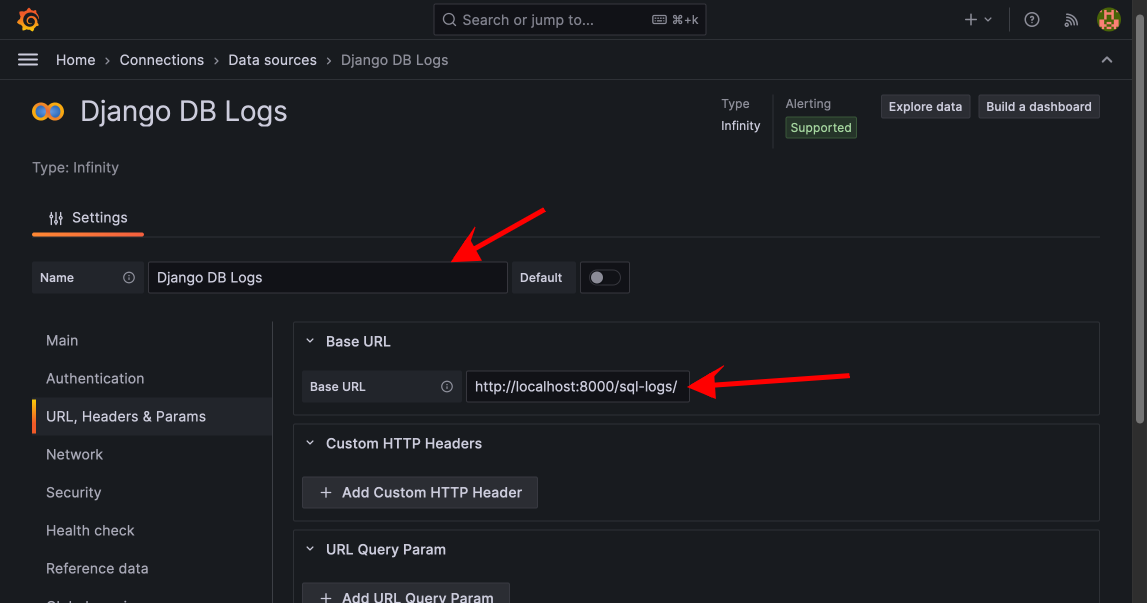
4. Under the Name field, give your data source a meaningful name (e.g., Django DB Logs).
In the Base URL field, enter the URL of the API that returns your log data. In this case, that will be http://localhost:8000/sql-logs/.
Query Data from the API#
Once the data source is connected, you can create panels in Grafana to visualize the logs.
Click Create > Dashboard.
Add a new Panel and configure it.
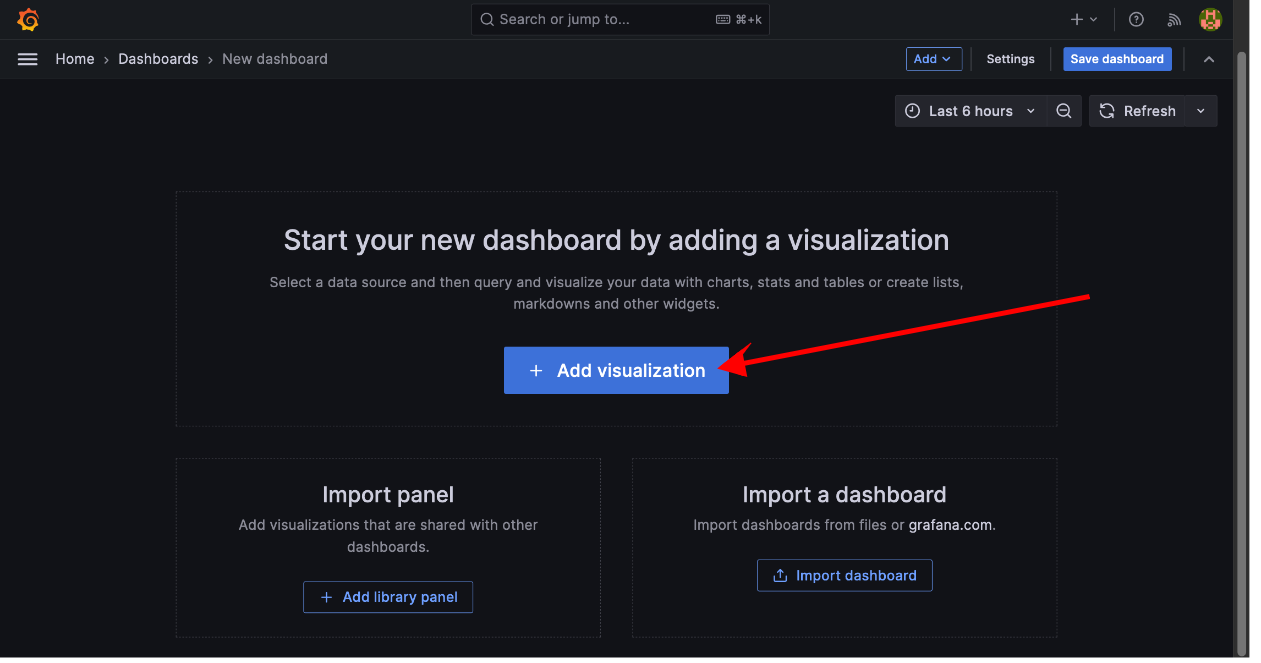
On the modal presented, select your Infinity data source.
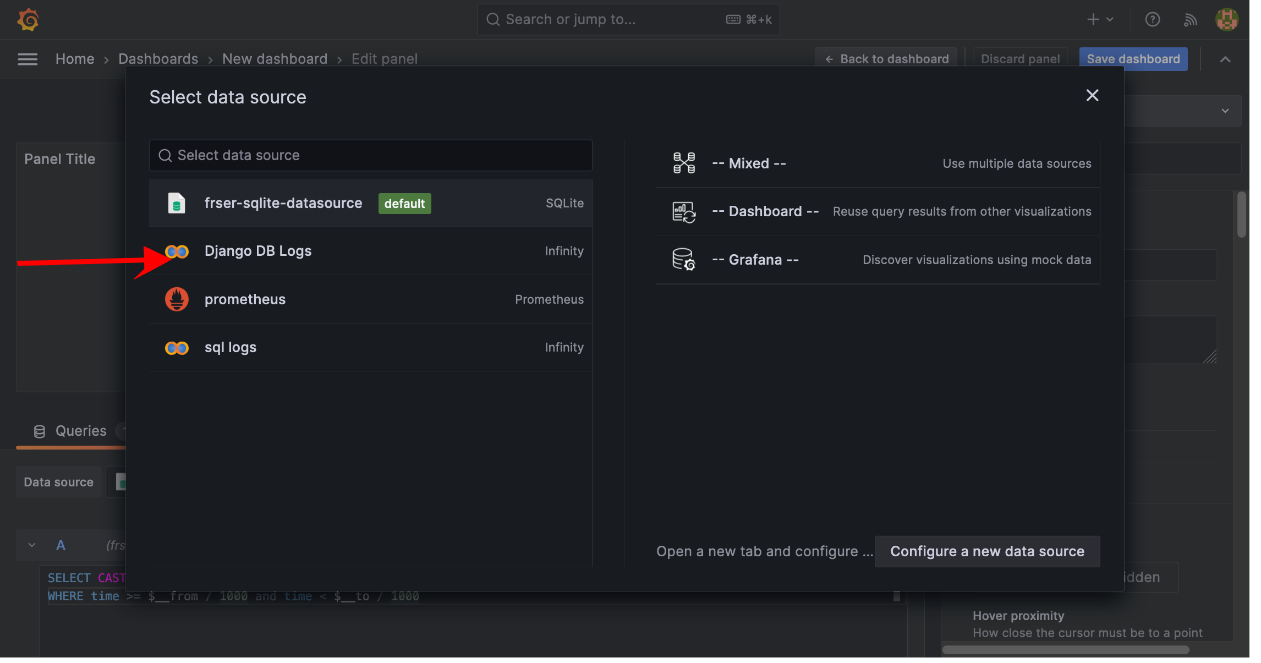
In the query editor, specify how to retrieve and display the data. You can choose between the following options:
Source: JSON URL.
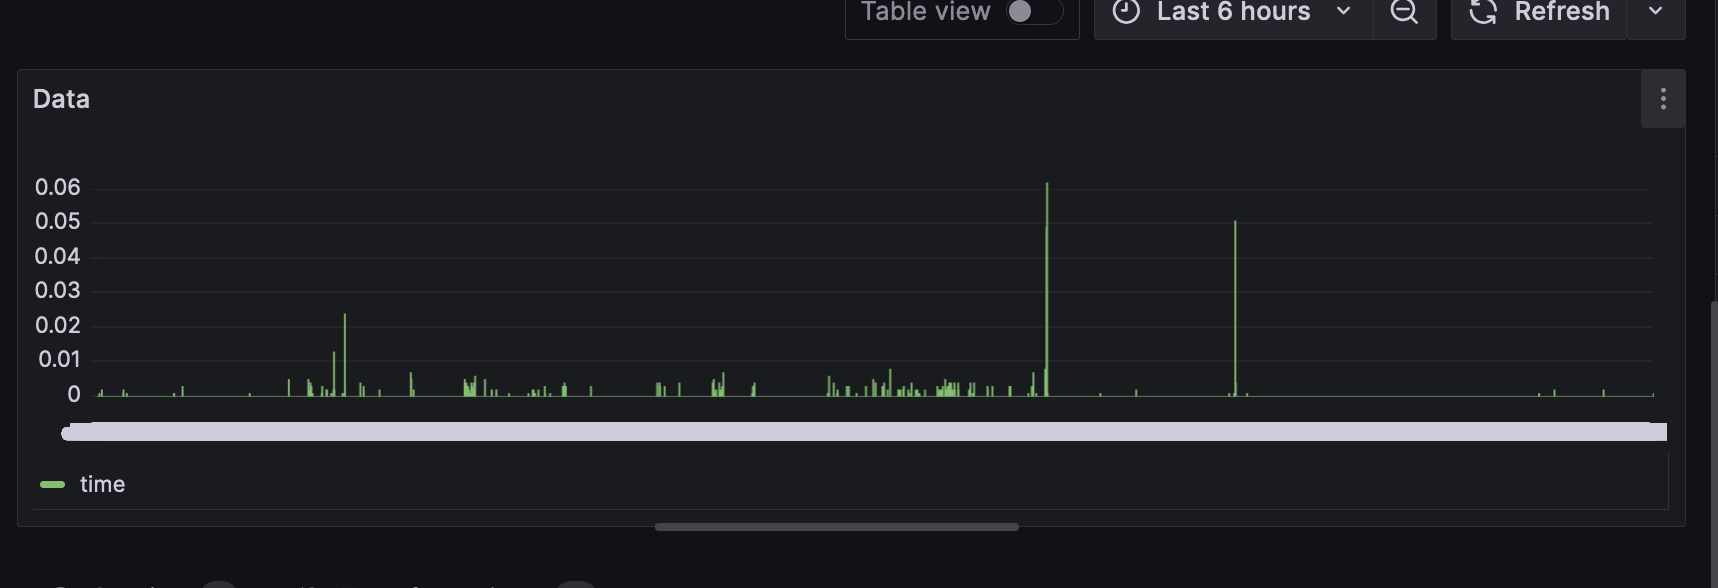
Format: Choose a Bar Chart so we can monitor to examine pics.
URL: The same API URL (
http://localhost:8000/sql-logs/).
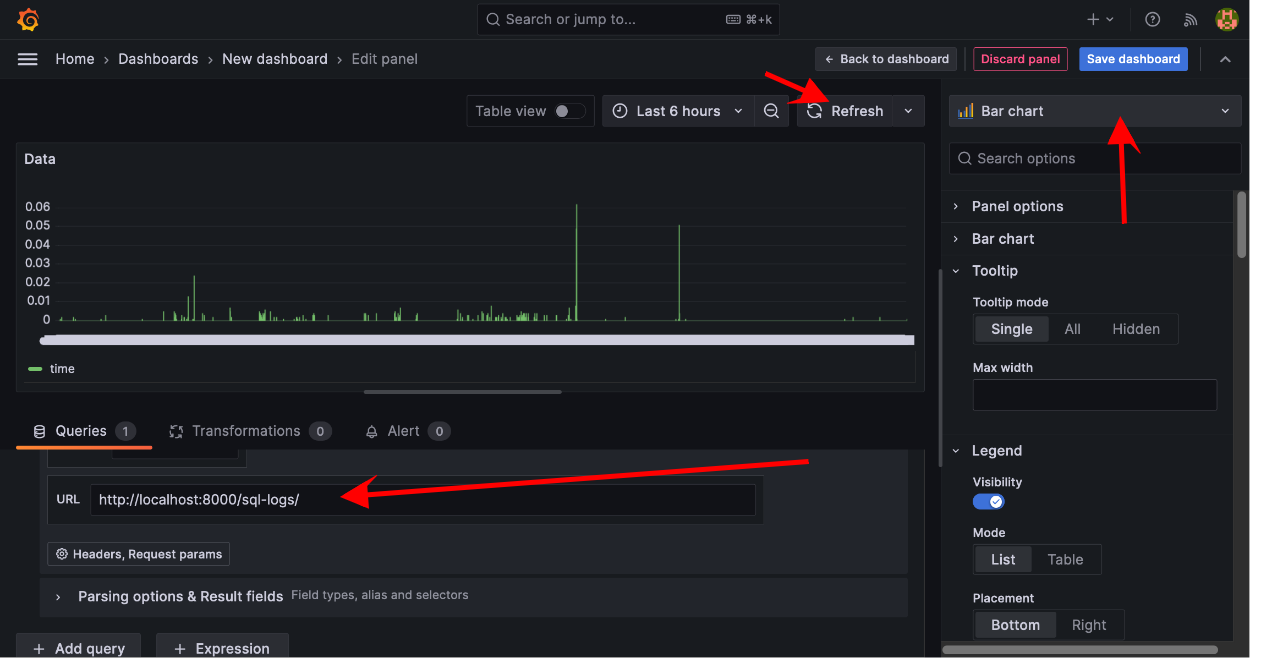
You can now click on Save dashboard and enter a title for the dashboard and a description if possible. We have now a view of the SQL query logs.
Conclusion#
In this page, we have learned how to integrate Django with Grafana to monitor our SQL queries. And you can track more data in many formats. Here is the documentation for Grafana for more.
You can find the code of the project created here.
Links#
👉 New to App-Generator? Join our 10k+ Community using GitHub One-Click SignIN.
👉 Download products and start fast a new project
👉 Bootstrap your startUp, MVP or Legacy project with a custom development sprint

